Bot Optimization Lab® White Paper
Built to Hold Up
BreakoutBOT®: Engineered for Robustness. Not Optimized for a Lucky Backtest.
Nine stages · 54 optimization runs · 4,662 parameter combinations · NQ futures, 2020–2026
Bot Optimization Lab® Report, Version 2.0 (October 2026)
Executive Summary
A strong backtest is easy to produce. A strategy that keeps working when the market changes is much harder to build. BreakoutBOT®, TradePilot AI’s opening range breakout strategy for NinjaTrader, was developed around that second goal. Over nine stages of research on the Nasdaq-100 E-mini (NQ) futures contract, the Bot Optimization Lab® tested 4,662 parameter combinations. It kept only settings that improved results in both a 2020–2023 development period and a 2024–2026 validation period, across rallies, declines and sideways markets.
The selected single-contract configuration produced these results from January 2020 through August 2026, after commissions and slippage:
$232,301
Net profit
1.36
Profit factor
$18,819
Maximum drawdown
12.34
Net profit per $1 of drawdown
55.4%
Win rate
924
Trades
Hypothetical backtest of one NQ contract. Not actual trading. See the risk disclosure at the end of this paper.
The numbers matter, but the method behind them matters more. This paper explains how they were earned, shows the charts behind them, and is plain about their limits.
The Problem: A Great Backtest Is Easy to Find
Any trading strategy can be tuned until it looks excellent on past data. Test enough settings and one will eventually fit history almost perfectly, often by chance. This is curve-fitting, and it is the most common reason a backtest disappoints in live trading. A setting that was merely lucky in the past has no reason to be lucky again.
Curve-fitting is hard to spot from the outside. A fitted strategy and a genuinely robust one can produce equally attractive equity curves. The difference shows up only when the strategy meets market conditions it was not tuned for, and by then the trader’s capital is on the line.
So the important question is not which settings made the past look best. It is which settings keep working when conditions change. That is the question BreakoutBOT® was built to answer.
How BreakoutBOT® Trades
BreakoutBOT® is an opening range breakout strategy. Starting at the 9:30 a.m. Eastern open, it records the high and low of the market’s first minutes. When a price bar closes decisively above or below that range, the bot enters in the direction of the break, with a predefined stop and profit target. It takes at most one trade per session, and its filters can keep it out of the market entirely on days when conditions do not qualify.
The premise behind opening range breakout strategies is that the first minutes of the session absorb overnight news and early order flow, and that a decisive break of that early range can point to the direction that follows. The research described below was designed to find out exactly which version of that idea holds up.
A Stricter Standard
The Bot Optimization Lab® split six and a half years of NQ data into two periods. The development period, 2020 to 2023, included a strong rally, a sharp decline and an extended sideways market. The validation period, 2024 to 2026, brought a steeper rally and sharper pullbacks. Every test was run on each period separately and on the full span.
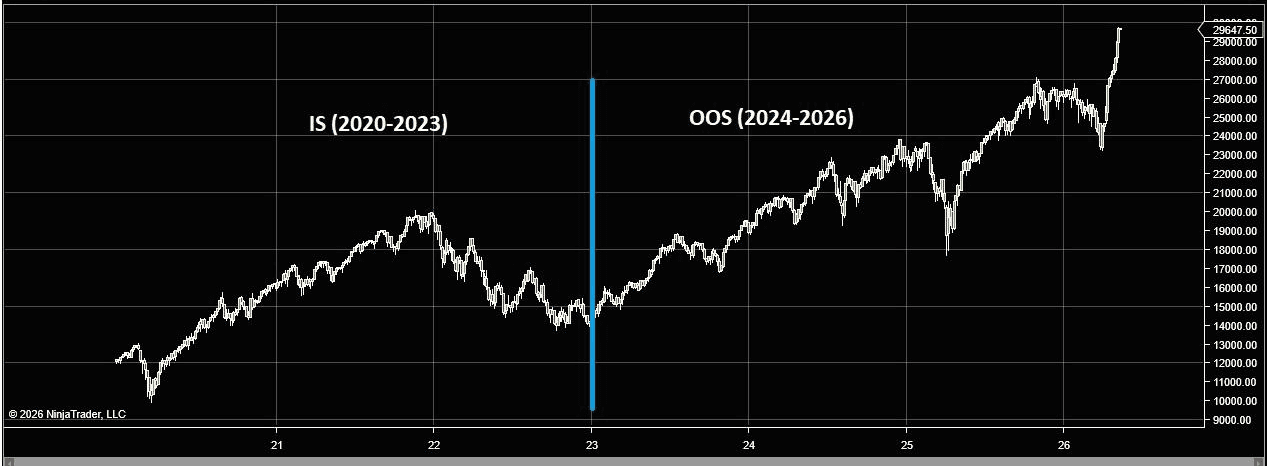
Four rules governed the research. First, a setting counted as robust only if it improved the profit factor in both periods at once; an improvement in just one was rejected. Second, the team chose robust zones, groups of neighboring settings that all performed well, rather than single standout values that might reflect luck. Third, combinations that produced too few trades were screened out, however good they looked. Fourth, every backtest included a $4.36 commission per trade and two points of slippage.
The team also removed a common source of backtest distortion. When the opening range does not divide evenly into the chart’s bar size, a simulated range includes minutes that would not exist in live trading. Every such combination was excluded, so the results reflect how the bot would actually see the market.
One point deserves candor. Because results from both periods informed the choices at each stage, the 2024–2026 data was not an untouched final exam. Its value is as a second, very different market environment in which every chosen setting also had to perform. That is a much stricter standard than optimizing on a single stretch of history, and it is the standard BreakoutBOT® was built to.
Nine Stages, One Decision at a Time
Rather than testing every setting at once, which multiplies the chances of finding a lucky combination, the research worked through the strategy in sequence. Each stage fixed the most important decision before moving to the next.
| Stage | What was tested | What was decided |
|---|---|---|
| 1 | Three ways to set stops and targets (range multiple, volatility/ATR, fixed ticks), plus a study of how far trades move | Fixed-tick stops and targets |
| 2 | Bar size used to confirm a breakout | 5-minute confirmation bar |
| 3 | Length of the opening range (15 to 60 minutes) | 15-minute opening range |
| 4 | Five individual filters: volume, VWAP, squeeze, daily trend and trade direction | Daily trend is the strongest filter; long-only helps; squeeze is inconclusive |
| 5 | Two-filter combinations built on long-only trading | Both combinations improved results in every stop-and-target pairing |
| 6 | Three filters together: long-only, volume and daily trend | Widest robust zone, at the cost of far fewer trades |
| 7 | Breakeven stop | Higher win rate, small profit-factor gain |
| 8 | Trailing stop | Small profit-factor gain |
| 9 | Trailing stop with a Runner (no fixed target) | Highest profit, with higher drawdown |
What the Research Found
Consistency beat headline results
Longer opening ranges looked impressive in development, then faded. A 60-minute range earned $6.78 of net profit for every dollar of drawdown in the development period, but only $0.61 in validation. That collapse is the signature of a setting tuned to one market. The 15-minute range, confirmed on a 5-minute bar, did the opposite. Its profit factor was 1.116 in development and 1.143 in validation, slightly better on the later data. It became the foundation of the strategy.
Fixed-tick exits proved most reliable
Stops and targets set in ticks produced the most compact robust zones, with 76% of the initial combinations passing the two-period test. Volatility-based (ATR) exits, a popular choice in many strategies, failed to break even in the initial tests and were dropped. Exits scaled to the size of the opening range were profitable but produced scattered, inconsistent zones.
Inside the Trades: Why the Stop Sits Where It Does
To understand how BreakoutBOT®’s trades actually behave, the team ran the strategy with stops and targets removed, holding every trade until the session closed. For each trade it recorded two numbers: how far the trade moved against the position at its worst (maximum adverse excursion, or MAE) and how far it moved in favor at its best (maximum favorable excursion, or MFE).
In the charts below, each marker is one trade. Green markers are trades that finished as winners; red markers finished as losers. The vertical axis shows the trade’s final result.
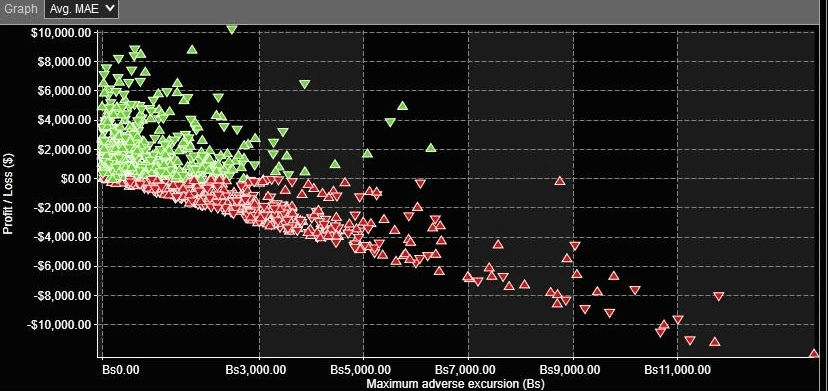
The adverse-excursion chart tells a clear story. Winning trades cluster tightly at the left edge: most of them never moved far against the position. Losing trades spread out to the right, many of them deep into loss. In the development period, the median winner went 127 ticks ($635) against the position at its worst; the median loser went 511 ticks ($2,555), four times as far. In validation the figures were 161 and 558 ticks, a ratio of 3.5 to 1.
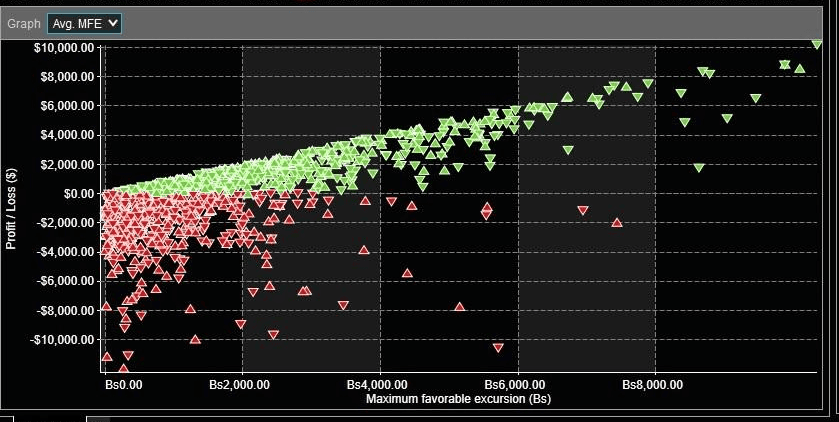
The favorable-excursion chart is the mirror image. Winners run far to the right; losers rarely get far before turning. The median winner reached 454 ticks of open profit in development and 589 ticks in validation, against 126 and 187 ticks for losers.
Together, the two charts show that winning and losing trades reveal themselves early, and that the pattern held in both periods. That gives BreakoutBOT®’s stop a principled location. The analysis indicated that a stop between 250 and 400 ticks would leave room for roughly 80–90% of winners to recover from their early dips, while cutting off 60–70% of losers before their worst point. The selected 300-tick stop sits inside that band, and it was confirmed independently by the optimization itself.
Filters: Fewer Trades, Better Trades
With the core strategy fixed, the team tested filters that keep BreakoutBOT® out of the market on days when a breakout is less likely to follow through. The table compares every valid filter configuration, using the average across each candidate’s own robust zone rather than its single best result.
Hypothetical backtest averages across each configuration’s robust zone, NQ futures, 2020–2026 combined, one contract.
| Configuration | Profit factor | Net profit / drawdown | Avg. maximum drawdown | Avg. trades |
|---|---|---|---|---|
| No filter (baseline) | 1.11 | 3.71 | $39,440 | 1,699 |
| Volume | 1.19 | 5.84 | $24,770 | 1,005 |
| VWAP | 1.13 | 4.25 | $35,120 | 1,576 |
| Daily trend | 1.25 | 8.15 | $21,350 | 924 |
| Daily trend + volume | 1.30 | 7.37 | $19,740 | 634 |
| Long only | 1.18 | 3.85 | $31,780 | 893 |
| Short only | 1.04 | 0.74 | $36,720 | 806 |
| Long only + volume | 1.29 | 6.08 | $23,110 | 613 |
| Long only + daily trend | 1.28 | 7.63 | $15,840 | 626 |
| Long only + volume + daily trend | 1.35 | 7.28 | $14,630 | 434 |
A daily-trend filter is the cleanest edge. Requiring trades to align with the daily trend was the most consistent improvement of any filter tested: 479 of its 480 combinations were robust. Across its robust zone, it nearly halved average drawdown and raised net profit per dollar of drawdown from 3.71 to 8.15, the best risk-adjusted result of any filter configuration. Adding further filters on top of it raised the profit factor, but did not improve on that ratio.
Every filter reduced drawdown. All ten filtered configurations lowered average drawdown compared with the unfiltered strategy, without exception.
Selectivity has a cost. The most selective combination, long-only trading with volume and daily-trend filters, raised the average profit factor from 1.11 to 1.35, with similar gains in both periods, and improved on long-only trading in all 180 combinations in its zone. It also traded far less: about half as often as long-only trading alone, and a quarter as often as the unfiltered strategy. Traders choose between selectivity and participation, and the research shows that trade-off rather than hiding it.
Trade management adds modest gains. Breakeven stops raised the win rate from 50–53% to 55–56%, with a small profit-factor gain. Trailing stops lifted the profit factor slightly. Across the broader test grid they did not consistently reduce drawdown, though in the configuration below they did.
The Results
For final validation, the team picked specific values inside the robust zones and ran complete NinjaTrader backtests from January 1, 2020 through August 2026. These are single runs of chosen settings, not optimization grids.
Hypothetical backtest results, NQ futures, after commissions and slippage. Not actual trading.
| Scenario 1 | Scenario 2 | Scenario 3 | |
|---|---|---|---|
| Configuration | Daily-trend filter; 300-tick stop, 600-tick target | Scenario 1 plus trailing stop | Three exits, including one Runner with no fixed target |
| NQ contracts | 1 | 1 | 3 |
| Net profit | $222,601 | $232,301 | $703,539 |
| Profit factor | 1.32 | 1.36 | 1.35 |
| Win rate | 52.2% | 55.4% | 56.1% |
| Maximum drawdown | $23,339 | $18,819 | $59,560 |
| Net profit / drawdown | 9.54 | 12.34 | 11.81 |
| Trades | 924 | 924 | 2,772 contract-trades |
| Longest losing streak | 7 | 7 | 21 contract-trades |
Profit factor is gross profit divided by gross loss. A profit factor of 1.36 means $1.36 was won for every $1.00 lost. It is not a percentage return.
Scenario 1: The core configuration
One NQ contract, a 15-minute opening range confirmed on a 5-minute bar, a 300-tick stop, a 600-tick target and the daily-trend filter (21-period EMA). This is BreakoutBOT® in its simplest validated form.
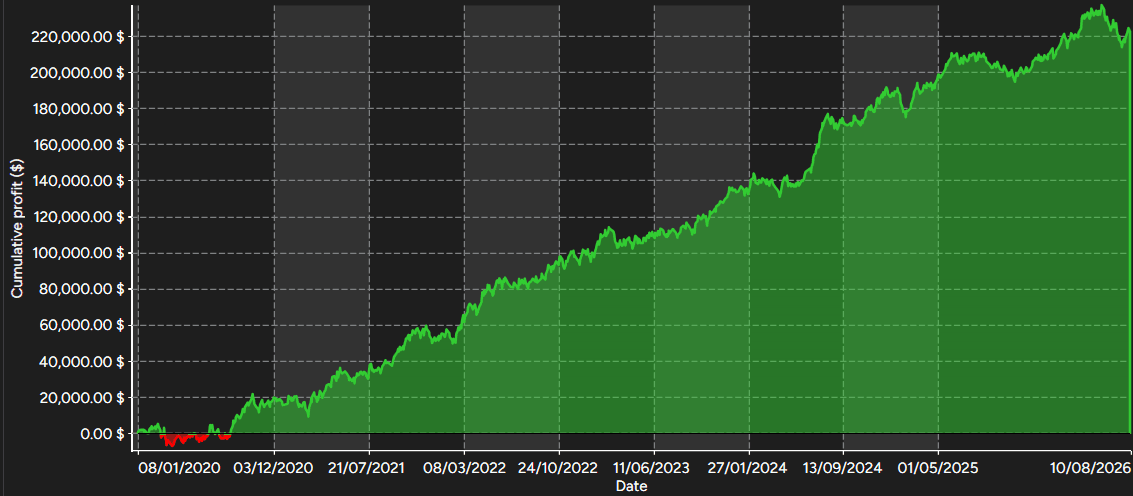
The curve shows a strategy that spent the first months of 2020 slightly below break-even before establishing a steady climb, closely tracking a straight trend line (R² of 0.99). It also shows that drawdowns are part of the journey: flat and declining stretches, such as mid-2025, are visible and real. Over 924 trades, the longest losing streak was seven trades, and both long and short trades were profitable.
Scenario 2: Adding a trailing stop
The same configuration with a trailing stop that activates after 400 ticks of open profit and trails 300 ticks behind price.
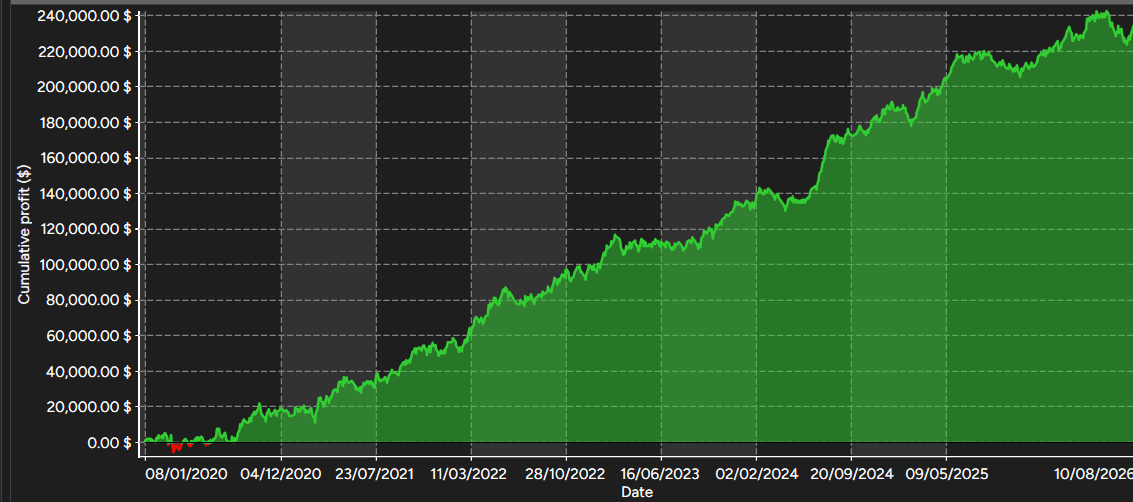
Adding the trailing stop raised net profit by about 4% and cut maximum drawdown by about 19%, lifting net profit per dollar of drawdown from 9.54 to 12.34. The win rate rose to 55.4%. The equity curve keeps the same steady shape (R² of 0.98). This is the configuration featured in the Executive Summary.
Scenario 3: Three contracts, three exits
Three contracts enter together, each with its own exit: one with a 600-tick target, one with a 700-tick target, and one Runner with no fixed target that exits only on the trailing stop.
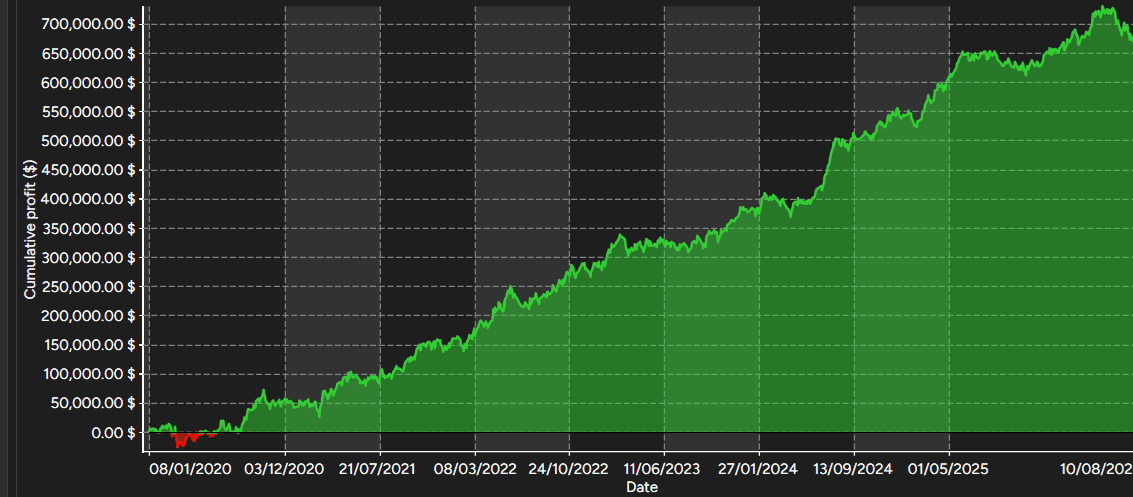
Scenario 3 is a different structure, not a bigger version of the same trade. It shows how exit design shapes results. It earned $703,539, roughly $234,500 per contract, but with three times the market exposure: a dollar drawdown of $59,560 and a longest losing streak of 21 contract-trades. Its equity curve is somewhat less even (R² of 0.92). Traders considering more than one contract should size positions to that larger drawdown, not to the single-contract figures.
Configured for Your Priorities
Because BreakoutBOT®’s settings came from zones rather than single points, traders are not relying on one fragile number. Within a validated zone, stops, targets and trade management can be adjusted to a trader’s own goals: the highest profit factor, the most profit per dollar of drawdown, or more frequent trading. The filter table above is, in effect, a menu of those trade-offs.
BreakoutBOT® runs natively in NinjaTrader, supports up to five contracts, and takes at most one trade per session, so its behavior is straightforward to understand and monitor. TradePilot AI recommends that every trader confirm a chosen configuration in simulation before trading it live.
What We Won’t Claim
Credibility is part of the product, so the research reports what did not work alongside what did. The Squeeze filter showed the largest profit-factor gain of any filter, but it produced too few trades to trust, so TradePilot AI does not recommend it. Trading short only weakened results and is not advised. Runner mode produced the highest single-contract profit in the project, $247,673, but also the worst drawdown in its test grid, and its best setting sat at the edge of the range tested. Account-level controls such as daily profit goals and loss limits were outside the scope of this study and will be evaluated in future multi-contract research.
Above all, these are backtests, not live results. A historical maximum drawdown is not a ceiling on future losses, and no testing method can guarantee that a strategy will keep working.
Conclusion
BreakoutBOT® was not built by asking which settings made the past look best. It was built by asking which settings kept working when the market changed, and by documenting the answer, including the parts that did not work. The result is a strategy with consistent historical behavior across neighboring settings and two very different market periods, backed by a research record traders can examine for themselves.
Don’t optimize for the past. Engineer for robustness beyond it.
BreakoutBOT®. Trade the Open. Keep the Edge.
Important Risk Disclosure
Hypothetical or simulated performance results have certain limitations. Unlike an actual performance record, simulated results do not represent actual trading. Also, since the trades have not been executed, the results may have under- or over-compensated for the impact, if any, of certain market factors, such as lack of liquidity. Simulated trading programs in general are also subject to the fact that they are designed with the benefit of hindsight. No representation is being made that any account will or is likely to achieve profits or losses similar to those shown.
All results and charts in this paper are hypothetical NinjaTrader backtests of NQ futures from January 1, 2020 through August 2026, including a $4.36 commission per trade and two points of slippage. Results have not been independently audited. Parameter selection used data from both the development and validation periods; repeated optimization can overstate future performance. Figures 2 and 3 come from an early-stage test with stops and targets removed and do not represent the final configuration. Historical maximum drawdown does not limit future losses. Live execution and future market conditions may produce materially different results. Futures trading involves substantial risk of loss and is not suitable for all investors. Past performance, actual or simulated, is not indicative of future results. BreakoutBOT® and Bot Optimization Lab® are registered trademarks of TradePilot AI. NinjaTrader is a trademark of NinjaTrader, LLC.