Bot Optimization Lab® White Paper
Cut Losers Fast. Let Winners Run.
VWAPBOT®: A VWAP Bounce Strategy Engineered for Robustness. Not Optimized for a Lucky Backtest.
Fourteen stages · 44 optimization runs · 19,745 parameter combinations · NQ futures, 2020–2026
A TradePilot AI white paper on the Bot Optimization Lab® Report for VWAPBOT® (October 2026)
Executive Summary
Professional traders watch one line more closely than almost any other: VWAP, the volume-weighted average price. It marks the average price paid during the session, and when the market pulls back to it in a rising session, buyers often step in. Trading that bounce is a well-known idea. Trading it profitably, year after year, is not. Most pullbacks to VWAP look the same in their first few minutes, and the difference between a real rebound and a false one decides everything.
VWAPBOT®, TradePilot AI’s VWAP bounce strategy for NinjaTrader, was built to make that distinction systematically. Over fourteen stages of research on the Nasdaq-100 E-mini (NQ) futures contract, the Bot Optimization Lab® tested 19,745 parameter combinations, each one in a 2020–2023 development period, a 2024–2026 validation period and the full span. It kept only settings that improved results in both periods at once, across rallies, declines and sideways markets.
The research produced a clear design: trade long only, confirm that VWAP itself is rising, keep the stop moderate, and replace a fixed profit target with a trailing stop that lets winning trades run. That core configuration was robust in 98% to 100% of every combination tested around it, the highest consistency of the entire project. Run as a single contract from January 2024 through October 2026, after commissions and slippage, it produced these results:
$116,946
Net profit
1.39
Profit factor
$24,371
Maximum drawdown
1.93
Average win / average loss
41.9%
Win rate
499
Trades
Hypothetical NinjaTrader backtest of one NQ contract, January 1, 2024 to October 2026, tick precision. Not actual trading. See the risk disclosure at the end of this paper.
The numbers matter, but the method behind them matters more. This paper explains how they were earned, shows the charts behind them, and is plain about their limits, including what did not work.
The Problem: Every Pullback Looks Like an Opportunity
Any trading strategy can be tuned until it looks excellent on past data. Test enough settings and one will eventually fit history almost perfectly, often by chance. This is curve-fitting, and it is the most common reason a backtest disappoints in live trading. A setting that was merely lucky in the past has no reason to be lucky again.
VWAP strategies face a second, more specific problem. A pullback to VWAP is a frequent event, and in its first few ticks a trade that will become a big winner moves almost exactly like one that will fail. Set the stop too tight and the strategy is shaken out of its best trades. Set a fixed profit target and it caps the very moves that pay for all the losers. Trade in both directions and the weaker side can quietly erase the stronger one.
So the important question is not which settings made the past look best. It is which settings keep working when conditions change, and which design choices give a real rebound room to develop while cutting a false one short. Those are the questions VWAPBOT® was built to answer.
How VWAPBOT® Trades
VWAPBOT® is a VWAP bounce strategy. It tracks the session’s volume-weighted average price and looks for price to pull back to that line and rebound, entering in the direction of the rebound with a predefined stop. In its validated configuration, VWAPBOT®:
- Anchors VWAP twice: once at the start of the session, as standard, and a second time at the 9:30 a.m. Eastern U.S. open, when NQ volume surges.
- Waits for the market to settle: entries are allowed from 10:00 a.m. to the 4:00 p.m. close, giving the open-anchored VWAP half an hour to form, on 3-minute bars.
- Trades long only, and only when VWAP itself has been rising by a minimum slope over the previous ten bars, so it buys pullbacks inside an established up-move rather than in a market drifting sideways.
- Protects every trade with a fixed stop of 250 ticks and a trailing stop that engages once a trade is 200 ticks in profit and then follows price 400 ticks behind. There is no fixed profit target. Open positions are closed at the end of the session.
In the core single-contract backtest, VWAPBOT® averaged fewer than one trade per day (0.72) and spent about two hours in the market per trade. Its behavior is straightforward to understand and to monitor.
A Stricter Standard
The Bot Optimization Lab® split six and a half years of NQ data into two periods. The development period, 2020 to 2023, included a strong rally, a sharp decline and an extended sideways market. The validation period, 2024 to 2026, brought a steeper rally and sharper pullbacks. Every test was run on each period separately and on the full span.
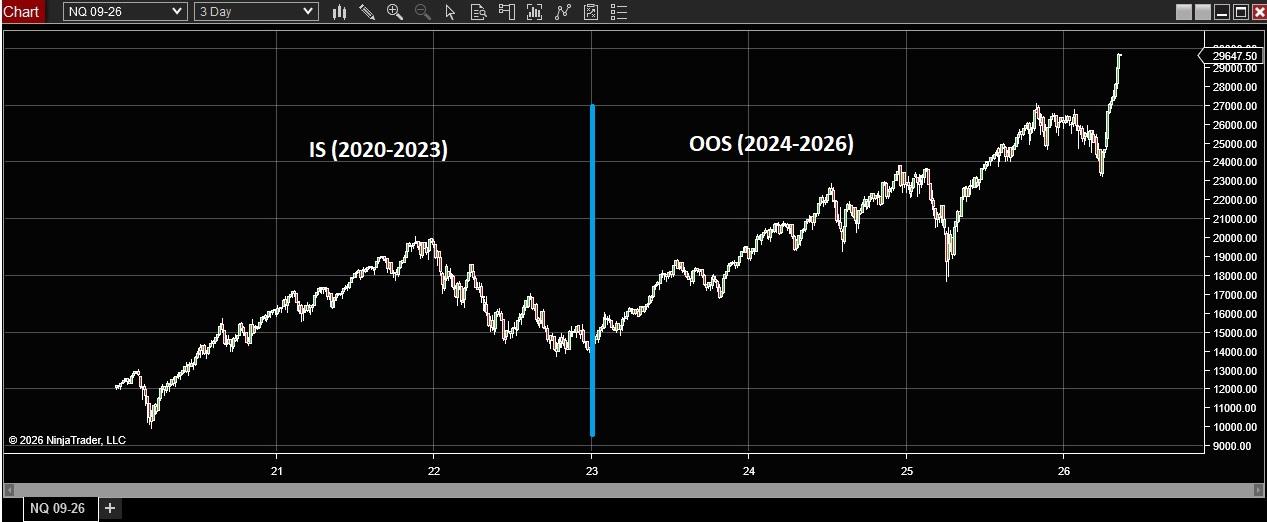
Four rules governed the research. First, a setting counted as robust only if it improved the profit factor in both periods at once; an improvement in just one was rejected. Second, the team chose robust zones, groups of neighboring settings that all performed well, rather than single standout values that might reflect luck. Third, combinations that produced fewer than 200 trades in any period were screened out, however good they looked. Fourth, every backtest included a $5.76 commission per trade and two points of slippage.
The team also compared candidates fairly. A larger test grid offers more chances to stumble on a lucky peak, so final comparisons use the average result across each candidate’s entire robust zone rather than its single best cell. That is a more conservative yardstick, and a better guide to what a trader can expect anywhere inside a validated zone.
One point deserves candor. Because results from both periods informed the choices at each stage, the 2024–2026 data was not an untouched final exam. Its value is as a second, very different market environment in which every chosen setting also had to perform. That is a much stricter standard than optimizing on a single stretch of history, and it is the standard VWAPBOT® was built to.
Fourteen Stages, One Decision at a Time
Rather than testing every setting at once, which multiplies the chances of finding a lucky combination, the research worked through the strategy in sequence. Each stage fixed the most important open decision before moving to the next.
| Stage | What was tested | What was decided |
|---|---|---|
| 1 | Stops and targets in ticks, standard session VWAP | No robust combination: the plain strategy does not work |
| 2 | Adding a second VWAP anchor at the 9:30 open | Robust combinations jump from 0 to 78 of 256 |
| 3 | How far trades move for and against the position | Winners and losers separate early; the grid, not averages, sets exits |
| 4 | Wider stop and target range; entries from 10:00 | Tighter stop, wider target; 120 of 441 robust |
| 5 | Long, short and both directions | Long only: 170 of 256 robust; short adds no edge |
| 6 | Moving-average (EMA) trend filter | Higher profit factor, fewer trades: a trade-off |
| 7 | VWAP slope filter, long side | Best filter found: 81% robust, more profit, less drawdown |
| 8 | VWAP slope filter, short side | At best 20% robust; short side not advised |
| 9 | Entry offset | Keep it small; larger offsets add trades of lower quality |
| 10 | Trailing stop with no fixed target (Runner) | 98–100% robust: the new core configuration |
| 11 | EMA filter on top of the core | Less profit; not adopted |
| 12 | Squeeze filter on top of the core | Too few trades to trust; not adopted |
| 13 | Higher-time-frame trend filters (daily, 4-hour, hourly) | Never improved profit in 4,800 cells; ruled out |
| 14 | Stops and targets scaled to volatility (ATR) | Nearly double the drawdown; not adopted |
What the Research Found
The 9:30 anchor turned a losing idea into a working one
The plain VWAP bounce, measured from the start of the overnight session, did not survive the two-period test. Not one of its 256 stop-and-target combinations was profitable in both periods, and the shortfall was not a lack of data: every combination had ample trades. Adding a second VWAP anchored at the 9:30 a.m. open, when the regular session’s heavy volume arrives, changed the picture immediately. Seventy-eight of the same 256 combinations became robust. That anchor is now a permanent part of VWAPBOT®.
Long only: one side carries the edge
Splitting results by direction was decisive. Long-only trading produced 170 robust combinations out of 256; short-only trading produced none, with a development-period profit factor that never reached 1.0 at any setting. Mixing the two did real damage. At the long side’s best setting, long-only trading earned $202,330 with a $31,230 drawdown, while trading both directions at the same setting earned only $83,631 with a $90,538 drawdown: about $120,000 less profit for nearly three times the risk. Every bit of robustness the two-way strategy showed came from its long trades.
The edge effect that wasn’t
In the early stages, the best zones kept sitting at the very top of the profit-target range tested, which normally suggests the range should be widened. The team tested that directly and found the real cause: the forced close at the end of the session. Beyond a certain size, a fixed target is simply never reached before the bell. With the stop held constant, net profit rose as the target widened to 1,050 ticks and then fell at 1,150. The true optimum was interior. That finding pointed to a better question than “how big a target?” and led to the trailing stop.
Confirm the trend, but don’t demand a steep one
The VWAP slope filter, which requires VWAP itself to be rising before VWAPBOT® buys a pullback, produced the largest single improvement of any filter. Across its fifteen settings, 49% to 81% of stop-and-target combinations were robust, a far higher floor than any earlier version. It also beat both the unfiltered long strategy and the moving-average filter on profit factor, net profit and drawdown at the same time. Just as telling, more slope was not better: robustness peaked at a moderate minimum slope and fell away on both sides (71%, 81%, 76%, 72% and 69% for slopes of 5 through 45). The filter works because it confirms a real trend, not because it chases the steepest ones.
Inside the Trades: Why the Stop Sits Where It Does
To understand how VWAPBOT®’s trades actually behave, the team ran the strategy with stops and targets removed and recorded, for each of 1,610 trades from 2020 to 2026, how far the trade moved against the position at its worst (maximum adverse excursion, or MAE) and how far it moved in favor at its best (maximum favorable excursion, or MFE). In the charts below, each marker is one trade. Green markers finished as winners; red markers finished as losers. The vertical axis shows the trade’s final result.
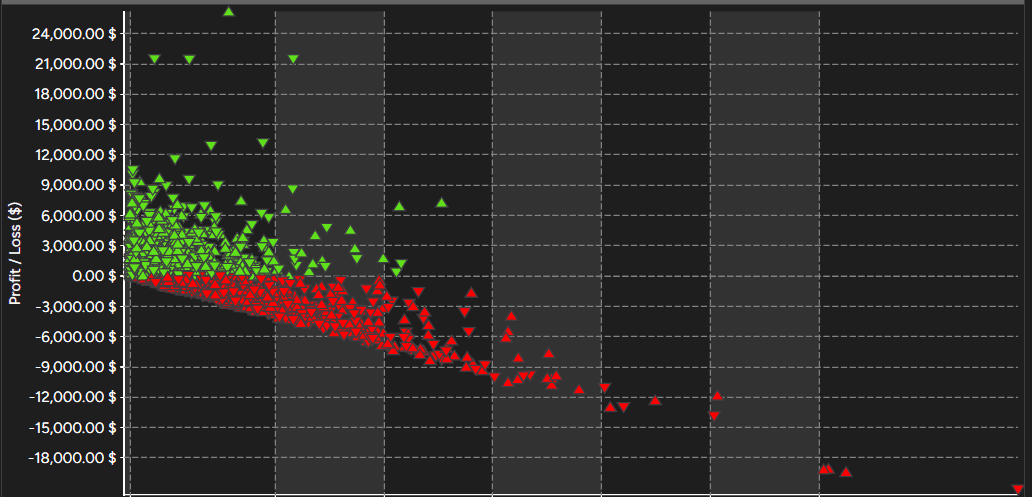
The adverse-excursion chart tells a clear story. Winning trades cluster tightly at the left edge: when the VWAP bounce is real, price barely moves against the position, just 151 ticks at the median. Losing trades spread out to the right, the median false bounce traveling 583 ticks against the position before failing, nearly four times as far.
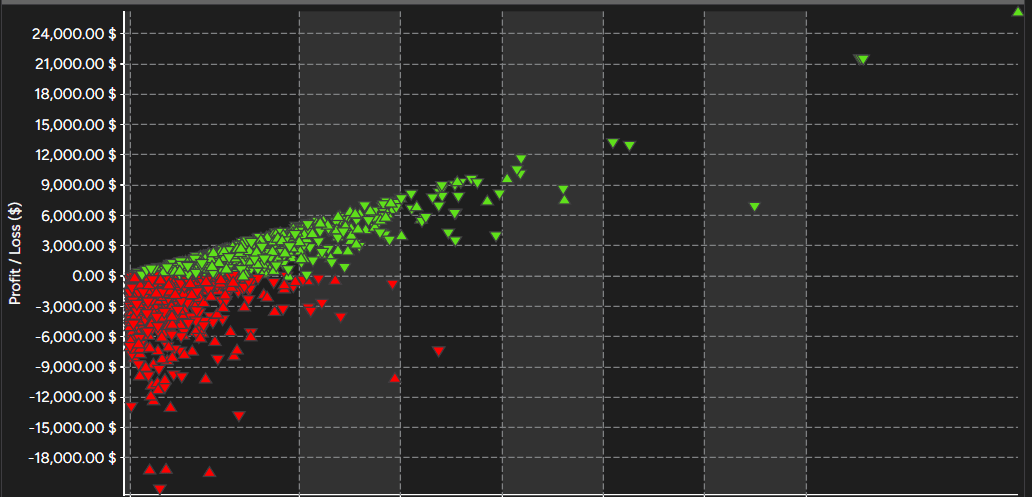
The favorable-excursion chart is the mirror image. Real rebounds keep going, with a median 562 ticks of open profit, and the largest winners run far to the right. That long right tail is exactly what a fixed profit target throws away.
Together, the charts explain VWAPBOT®’s exit design. A stop that is too tight is costly: at 50 ticks, 81% of eventual winners would have been stopped out early, and even at 150 ticks half of them would, because in the first few ticks winners and losers move almost identically. A moderate stop lets real rebounds survive and still cuts false ones off well before their worst point. The optimization confirmed this independently: in all sixteen trailing-stop configurations tested, without exception, the best stop was 250 ticks, a clear peak in the middle of the range rather than at its edge.
One candid note. Averages of these excursions, taken alone, pointed to a symmetric stop and target near 500 ticks, and that zone did not hold up in the optimization grid. Trade-level analysis explains the behavior; only the full two-period grid decides the settings.
Let Winners Run: The Trailing Stop
Every fixed target, however well calibrated, cuts off the biggest moves. So the team replaced the target with a trailing stop: once a trade reaches a set profit, a protective stop follows price and the position stays open until the move ends or the session closes. This was the project’s breakthrough.
- Unmatched consistency. All sixteen trailing-stop configurations were robust in 44 or 45 of their 45 stop-and-activation combinations, 98% to 100%, well above the best fixed-target result of 81%.
- Less risk per dollar earned. Its best setting earned $188,178 over 2020–2026 with a maximum drawdown of $17,826, a profit factor of 1.44 and $10.56 of net profit for every dollar of drawdown. The best fixed-target setting earned more, $230,916, but with a 60% larger drawdown and a ratio of 8.09.
- Early protection works best. In all sixteen configurations, activating the trailing stop at the smallest profit level tested (200 ticks) beat waiting for a larger gain.
The trailing stop changes the strategy’s signature. VWAPBOT® wins roughly 40% of its trades rather than 50% to 60%, and makes up for it with average winners about twice the size of average losers. That is by design: the bot cuts what is not working quickly and lets what is working run. The research also showed that chasing a higher win rate under this design makes risk-adjusted results worse, not better. The strongest results came from cells with win rates of 40% to 46%.
Filters: Less Is More
The first table traces the chain of decisions that built VWAPBOT®’s core. The second shows what happened when further filters were added on top of it. Both use the average across each configuration’s own robust zone, not its single best result.
Table 1. Building the core. Hypothetical backtest averages across each configuration’s robust zone, NQ futures, 2020–2026 combined, one contract.
| Configuration | Profit factor | Net profit / drawdown | Avg. maximum drawdown | Avg. net profit | Avg. trades | % robust |
|---|---|---|---|---|---|---|
| Baseline: both directions, fixed target | 1.06 | 1.52 | $61,140 | $89,950 | 2,211 | 27% |
| Long only | 1.11 | 3.61 | $42,390 | $139,520 | 1,454 | 66% |
| Long + EMA trend filter | 1.17 | 4.53 | $36,210 | $155,310 | 1,075 | 67% |
| Long + VWAP slope filter | 1.19 | 4.69 | $35,010 | $156,990 | 980 | 81% |
| Short + VWAP slope filter | 1.05 | 0.67 | $27,520 | $18,570 | 938 | 20% |
| Long + slope + small offset | 1.18 | 4.57 | $35,280 | $149,270 | 1,006 | 81% |
| Core: long + slope + trailing stop | 1.34 | 7.67 | $20,280 | $150,520 | 705 | 98% |
Table 2. Filters tested on top of the core. Same basis as Table 1.
| Configuration | Profit factor | Net profit / drawdown | Avg. maximum drawdown | Avg. net profit | Avg. trades | % robust |
|---|---|---|---|---|---|---|
| Core (trailing stop) | 1.34 | 7.67 | $20,280 | $150,520 | 705 | 98% |
| Core + EMA trend filter | 1.33 | 5.61 | $21,200 | $116,270 | 559 | 100% |
| Core + daily trend filter | 1.29 | 4.12 | $18,040 | $74,220 | 414 | 100% |
| Core + 4-hour trend filter | 1.30 | 3.78 | $20,060 | $75,530 | 386 | 100% |
| Core + hourly trend filter | 1.24 | 4.73 | $16,830 | $78,810 | 494 | 80% |
| Volatility (ATR) exits instead | 1.16 | 3.59 | $31,030 | $108,990 | 921 | 66% |
The core outperformed every alternative. Compared with the starting configuration, the trailing-stop core raised the average profit factor by 26%, increased average net profit by 67%, cut average drawdown by two-thirds and multiplied net profit per dollar of drawdown roughly fivefold, from 1.52 to 7.67, the largest improvement in the study.
Going long only was the foundation. That single change, before any filter, raised average net profit by 55% and more than doubled net profit per dollar of drawdown.
Adding more filters made results worse. Every filter layered on top of the core lowered its net profit per dollar of drawdown, by 27% to 53%. A cell-by-cell comparison makes the point sharply. The moving-average filter improved net profit in only 16% of 1,000 matched cells. The three higher-time-frame trend filters, across 4,800 matched cells, improved net profit in none. They reduced drawdown in many cells, but never in exchange for more profit, and the same drawdown control is available simply by adjusting the stop.
Volatility-scaled exits doubled the risk. Stops and targets set as multiples of the average true range (ATR), a popular choice in many strategies, earned about the same as the core in their best setting but with nearly twice the drawdown.
Higher profit is available, at a price. The slope and moving-average configurations in Table 1 earned slightly more on average than the core, but with drawdowns roughly 75% larger and many more trades. VWAPBOT® favors the better risk profile, and the tables let traders see the trade-off for themselves.
The Results
For final validation, the team picked specific values inside the robust zones and ran complete NinjaTrader backtests at tick precision over the validation period, January 1, 2024 through October 2026. These are single runs of chosen settings, not optimization grids.
Hypothetical backtest results, NQ futures, January 2024 to October 2026, after commissions and slippage. Not actual trading.
| Scenario 1 | Scenario 2 | Scenario 3 | |
|---|---|---|---|
| Configuration | Core: long only, slope filter, 250-tick stop, trailing stop, no fixed target | Three contracts, three exits: one Runner and two fixed targets | Scenario 2 plus EMA trend filter (8/21) |
| NQ contracts | 1 | 3 | 3 |
| Net profit | $116,946 | $248,261 | $302,350 |
| Profit factor | 1.39 | 1.24 | 1.37 |
| Win rate | 41.9% | 41.3% | 43.1% |
| Average win / average loss | 1.93 | 1.77 | 1.80 |
| Maximum drawdown | $24,371 | $55,994 | $41,097 |
| Net profit / drawdown | 4.80 | 4.43 | 7.36 |
| Trades | 499 | 1,314 contract-trades | 1,099 contract-trades |
| Longest losing streak | 14 | 30 contract-trades | 24 contract-trades |
| R² of equity curve | 0.92 | 0.90 | 0.96 |
Profit factor is gross profit divided by gross loss. A profit factor of 1.39 means $1.39 was won for every $1.00 lost. It is not a percentage return.
Scenario 1: The core configuration
One NQ contract, long only, with the double VWAP anchor, entries from 10:00 a.m., a minimum VWAP slope of 35 over ten bars, a small entry offset, a 250-tick stop, and a trailing stop that activates at 200 ticks of profit and trails 400 ticks behind. This is VWAPBOT® in its simplest validated form.
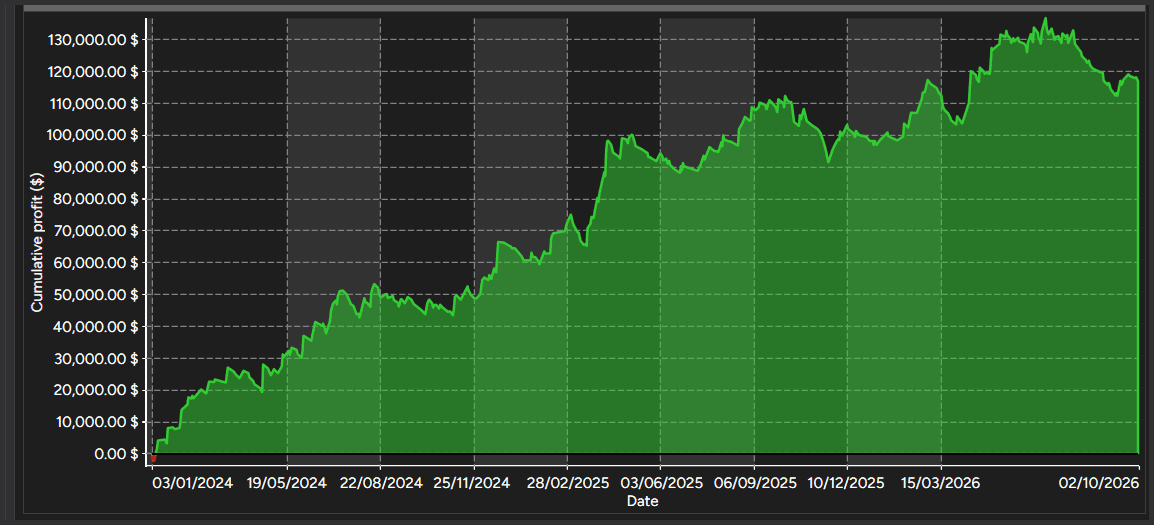
The curve shows a strategy that moved into profit almost immediately and climbed steadily through 2024 and early 2025, with an R² of 0.92 against a straight trend line. It also shows that drawdowns are part of the journey. Flat stretches in mid-2024 and the second half of 2025 are visible, and the curve gave back about $18,000 from its peak in the final months of the test. The asymmetry that drives the strategy is plain in the trade statistics: the largest single loss was $1,326, while the largest single win was $10,544, the Runner at work.
Scenario 2: Three contracts, three exits
Three contracts enter together, each with its own exit: one Runner with a 150-tick stop and no fixed target, one with a 350-tick stop and a 450-tick target, and one with a 250-tick stop and a 750-tick target. All three share the slope filter and a trailing stop that activates at 600 ticks of profit.
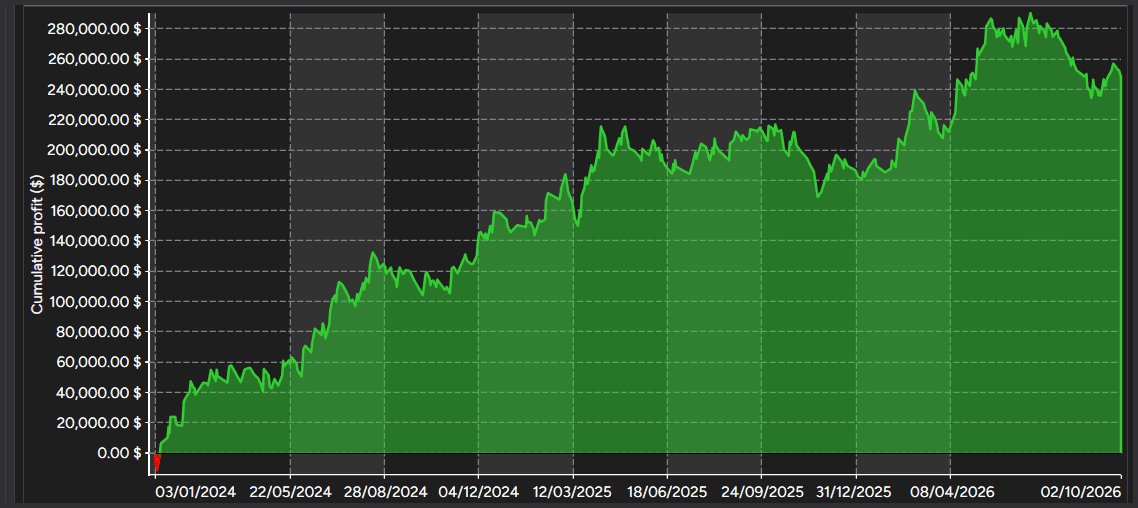
Scenario 2 is a different structure, not a bigger version of the same trade, and it shows how exit design shapes results. It earned $248,261, about $82,750 per contract, less per contract than the single-contract core, with a lower profit factor of 1.24. With three times the market exposure, its drawdown was $55,994 and its longest losing streak 30 contract-trades. Traders considering more than one contract should size positions to that larger drawdown, not to the single-contract figures.
Scenario 3: Adding a trend filter to the multi-contract structure
The same three-contract structure, with a moving-average trend filter (8- and 21-period EMAs) added.
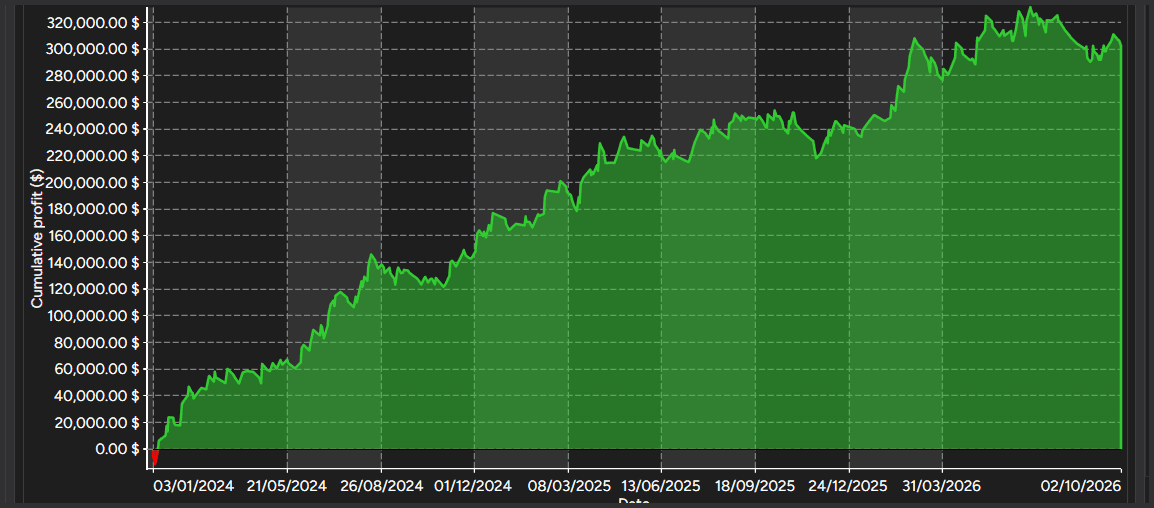
Adding the filter raised net profit by 22% to $302,350 while cutting maximum drawdown by 27% to $41,097, lifting net profit per dollar of drawdown from 4.43 to 7.36. The equity curve is the smoothest of the three (R² of 0.96). These are the strongest multi-contract results in the study. They are also the least tested, for the reasons set out below, and TradePilot AI presents them as a promising direction rather than a finished recommendation.
Configured for Your Priorities
Because VWAPBOT®’s settings came from zones rather than single points, traders are not relying on one fragile number. Within the core’s robust zone, stops from 100 to 450 ticks and trailing-stop activation levels from 200 to 600 ticks all passed the two-period test, so a trader can lean toward the highest profit factor, the most profit per dollar of drawdown, or more frequent trading. The tables above are, in effect, a menu of those trade-offs.
VWAPBOT® runs natively in NinjaTrader, supports up to five contracts, and uses a small number of clear, interpretable settings: two VWAP anchors, a trading window, a slope requirement, a stop and a trailing stop. TradePilot AI recommends that every trader confirm a chosen configuration in simulation before trading it live.
What We Won’t Claim
Credibility is part of the product, so the research reports what did not work alongside what did.
- Short trading is not advised. The short side showed no edge of its own in any test, with or without the slope filter. VWAPBOT®’s validated configuration is long only.
- The core’s edge was stronger in development than in validation. Across its robust zone, the trailing-stop core averaged $5.71 of net profit per dollar of drawdown in 2020–2023 and $2.06 in 2024–2026. It remained the best configuration in both periods, but several alternatives were more even between them.
- Scenario 3 needs more validation. In the systematic grid tests, adding a moving-average filter to the core did not improve results, and the 8/21 setting used in Scenario 3 lies outside the values tested there. Its strong showing is encouraging, not yet proven.
- Some settings sit at the edge of the range tested. The best trailing-stop activation level was the smallest tested, so a lower level could perform differently, for better or worse.
- The Squeeze filter is not recommended. It improved profit factor and drawdown, but cut trades by two-thirds and net profit by 69%, and it was screened on a single period without validation.
- Account-level controls were outside the scope of this study. Daily profit goals, loss limits and profit protection were held off throughout and will be evaluated in future multi-contract research.
Above all, these are backtests, not live results. The scenario backtests cover a period that also informed the choice of settings. A historical maximum drawdown is not a ceiling on future losses, and no testing method can guarantee that a strategy will keep working.
Conclusion
VWAPBOT® was not built by asking which settings made the past look best. It was built by asking which settings kept working when the market changed, and by documenting the answer, including the parts that did not work. The research turned a VWAP bounce that failed the two-period test into a strategy that passed it in nearly every configuration tested around its core: anchored to the open, long only, confirmed by a rising VWAP, protected by a moderate stop, and free to let its winners run. The result is backed by a research record traders can examine for themselves.
Don’t optimize for the past. Engineer for robustness beyond it.
VWAPBOT®. Buy the Bounce. Let It Run.
Important Risk Disclosure
Hypothetical or simulated performance results have certain limitations. Unlike an actual performance record, simulated results do not represent actual trading. Also, since the trades have not been executed, the results may have under- or over-compensated for the impact, if any, of certain market factors, such as lack of liquidity. Simulated trading programs in general are also subject to the fact that they are designed with the benefit of hindsight. No representation is being made that any account will or is likely to achieve profits or losses similar to those shown.
All results and charts in this paper are hypothetical NinjaTrader backtests of NQ futures, including a $5.76 commission per trade and two points of slippage. Optimization results cover January 1, 2020 through August 2026; scenario backtests (Figures 4–6 and the Executive Summary figures) cover January 1, 2024 through October 2026 at tick precision. Results have not been independently audited. Parameter selection used data from both the development and validation periods; repeated optimization can overstate future performance. Figures 2 and 3 come from an early-stage test with stops and targets removed and do not represent the final configuration. Multi-contract trade counts and losing streaks are stated in contract-trades. Historical maximum drawdown does not limit future losses. Live execution and future market conditions may produce materially different results. Futures trading involves substantial risk of loss and is not suitable for all investors. Past performance, actual or simulated, is not indicative of future results. VWAPBOT® and Bot Optimization Lab® are registered trademarks of TradePilot AI. NinjaTrader is a trademark of NinjaTrader, LLC.